Marco Barandun, Agroscope and University of Zurich, discusses his article: Scaling species richness: When vegetation surveys don’t match in plot area
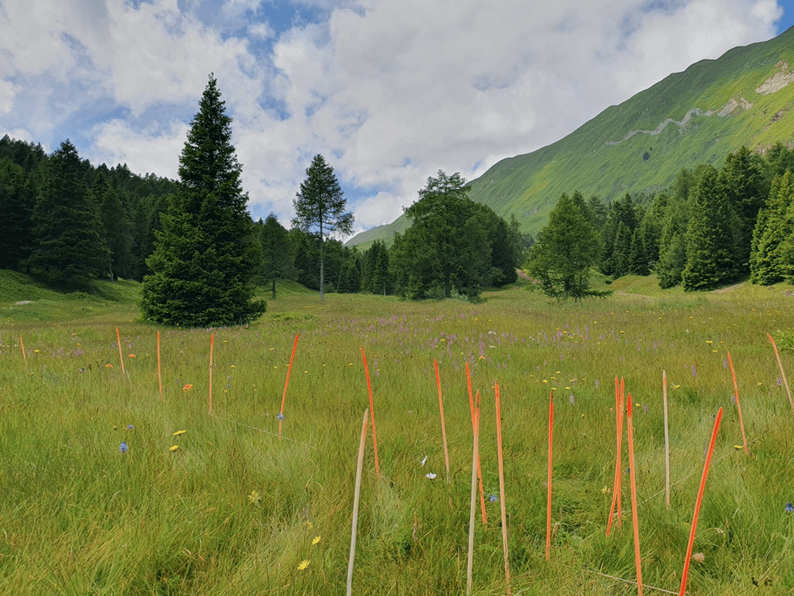
What can you do when your dataset contains vegetation surveys with plots the size of a shoebox alongside plots the size of a living room? This was exactly the situation I found myself in at the start of my PhD. I had historical and contemporary grassland surveys — some surveyed at 0.09 m², some at 25–28 m², and others at 100 m².
Comparing species richness or ecological indicator values across such different plot areas is not straightforward, but it is also a common problem: historical datasets often follow different sampling traditions, and multi-study syntheses struggle to integrate surveys originally designed with differing objectives. In addition, ecological indicator values — derived from the environmental preferences of plant species — help us infer site conditions such as light, moisture, or nutrient levels. However, when plot areas differ, both richness and these indicator-based summaries may shift simply because surveys capture different amounts of microhabitat heterogeneity.

To address this, we evaluated how best to harmonise species richness across surveys of different plot areas and tested how ecological indicator values respond to variation in plot area. Even if modest area differences may not completely derail an analysis, important questions remain: How can surveys from different plot sizes be compared reliably? How large can these differences be before comparisons break down? And what level of error do plot area differences introduce into our analyses?
We focused on species richness and ecological indicator values because these metrics capture fundamental aspects of vegetation structure and site conditions, and — crucially — they can be calculated from virtually any complete species list, even for historical surveys potentially lacking coordinates, precise dates, or detailed metadata.
To tackle the issue of differing plot areas, we first tested various ways of harmonising species richness. We contrasted the classic species–area relationship — a simple, theory-anchored approach with a long ecological tradition — with random forest models, which offer greater flexibility and can provide a closer fit but require far more observations and tend to overfit at small spatial scales. Despite its simplicity, the species–area relationship performed remarkably well in scaling species richness, outperforming more complex approaches when plot sizes differed only moderately, while random forest models performed best when area differences became very large. Surprisingly, a single constant scaling parameter in the species–area relationship achieved nearly the same accuracy as models where the parameter was predicted separately for each survey.
Second, we examined whether ecological indicator values shift systematically with plot area. They did not: average ecological indicator values proved to be remarkably robust, showing almost no effect of area across the range of plot sizes used in grassland vegetation surveys.
Taken together, these results show that even vegetation surveys conducted at different plot areas can be made comparable with simple adjustments. Species richness can be harmonised using the species-area relationship and a constant, while ecological indicator values appear remarkably stable across plot areas. This opens the door to re-using historical surveys, integrating datasets across regions, and carrying out syntheses that were previously very difficult due to differences in plot area among surveys.

